I had a hunch that this year there have been more 40-point blowouts compared to the previous years. To look in to the data, I pulled game data from basketball-reference.com.
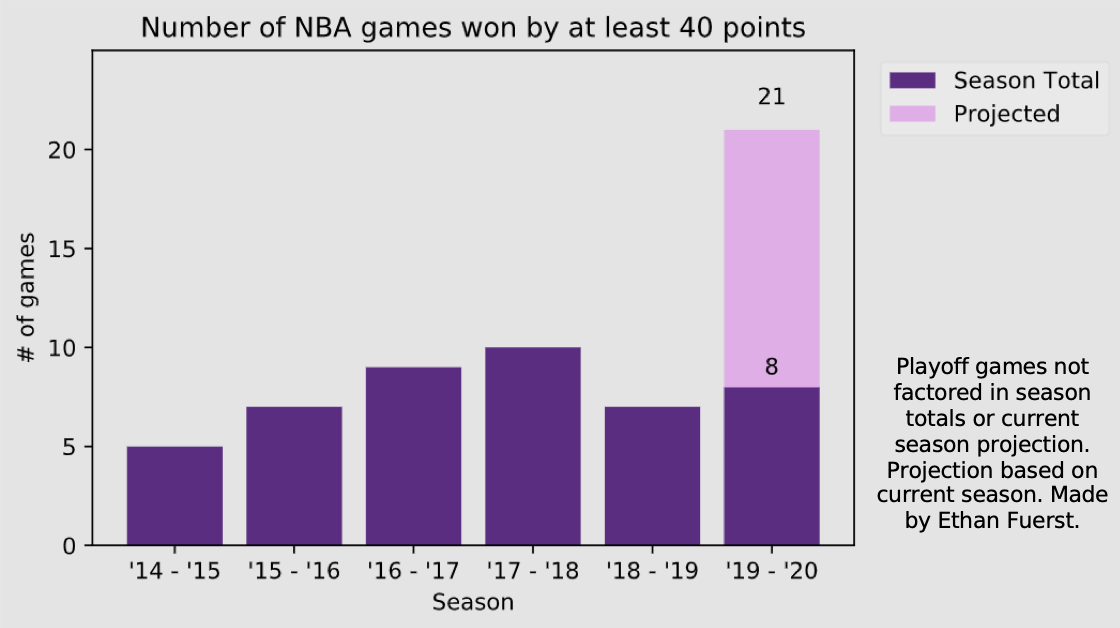
In the last 5 seasons, there had been between 5-10 blowouts by 40 points. So far in this season, there had been 8 40-point blowouts, and if they continue at the current rate we would end with 21.
Next I wanted to look at how many 20, 30 and 40-point blowouts there were each season in the last few seasons.
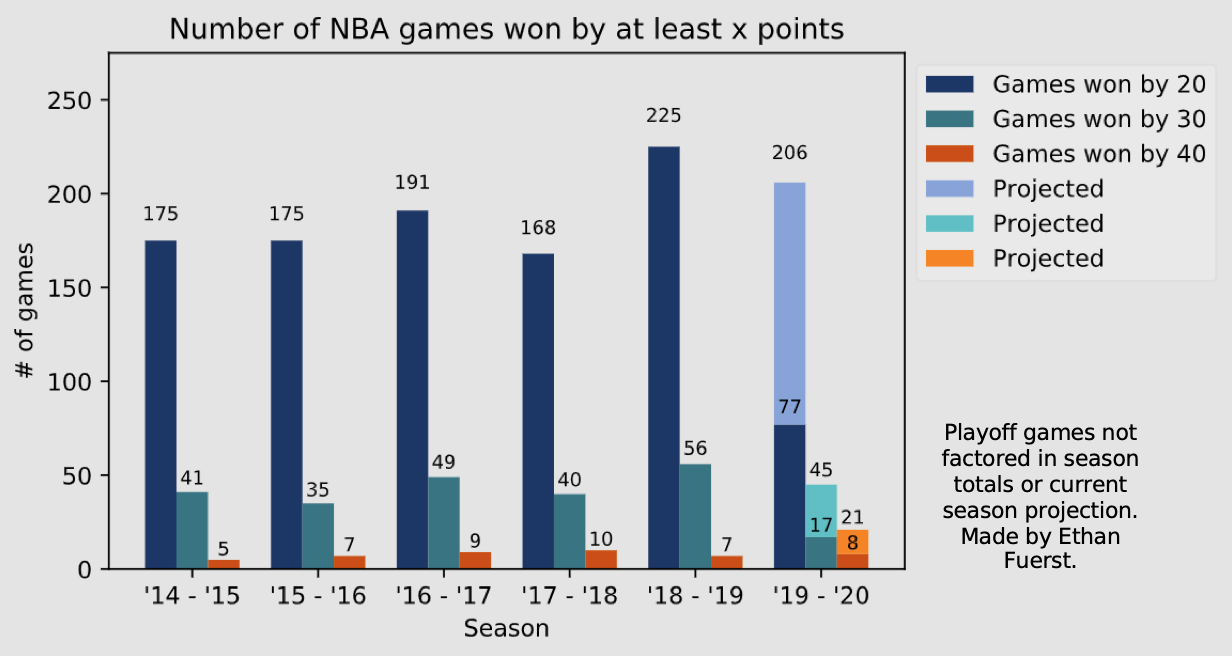
Using the current season to project the rate of blowouts, there would be about the same amount of 20 and 30-point blowouts as the last 5 years, but more than twice as many 40-point blowouts.
So what does the distribution of blowouts throughout the season look like? First I graphed 30-point blowouts.
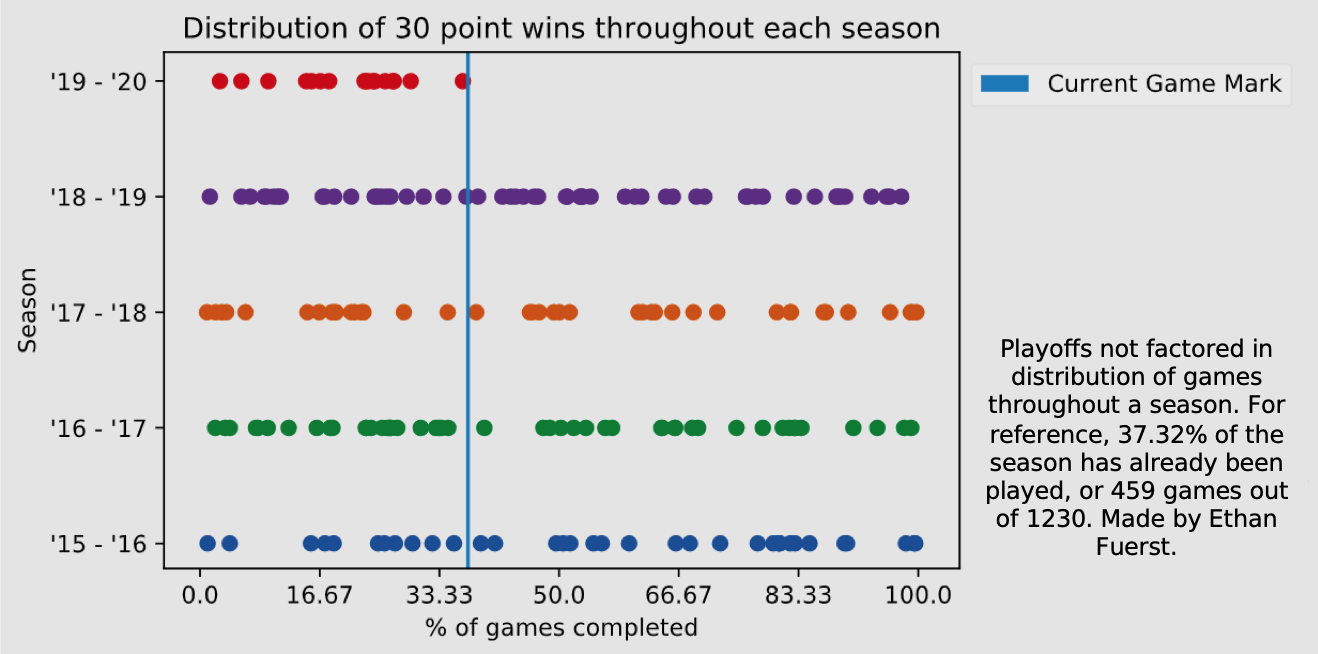
30-point blowouts are pretty evenly distributed, so this doesn't really tell us much.
I'm more interested in the distribution of 40-point blowouts.
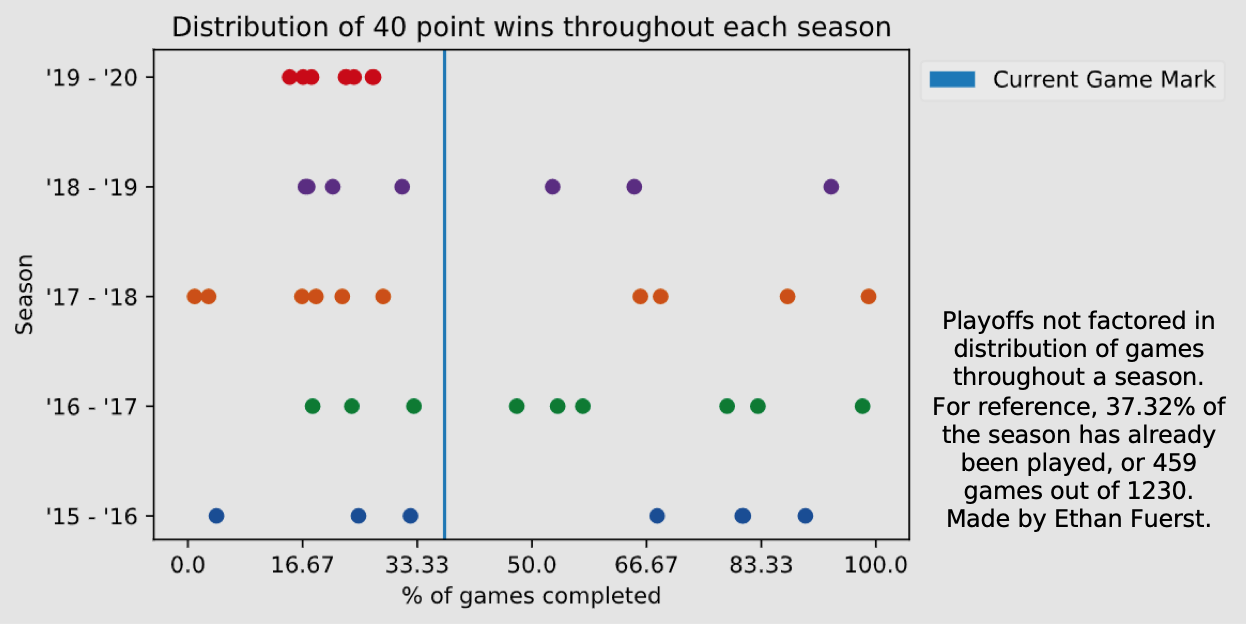
I had some ideas why there would be more 40-point blowouts later or earlier in the season. It could be that good teams win by 40 in the beginning of the year to make a statement, or bad teams lose by 40 at the end of the year because they've given up.
Either way, I wanted to find the projected rate of 40-point blowouts this season using the percent of blowouts in the past seasons at the current game mark. Basically, if this season's 'blowout rate' was the same as a past season's 'blowout rate', how many blowouts will this season have?
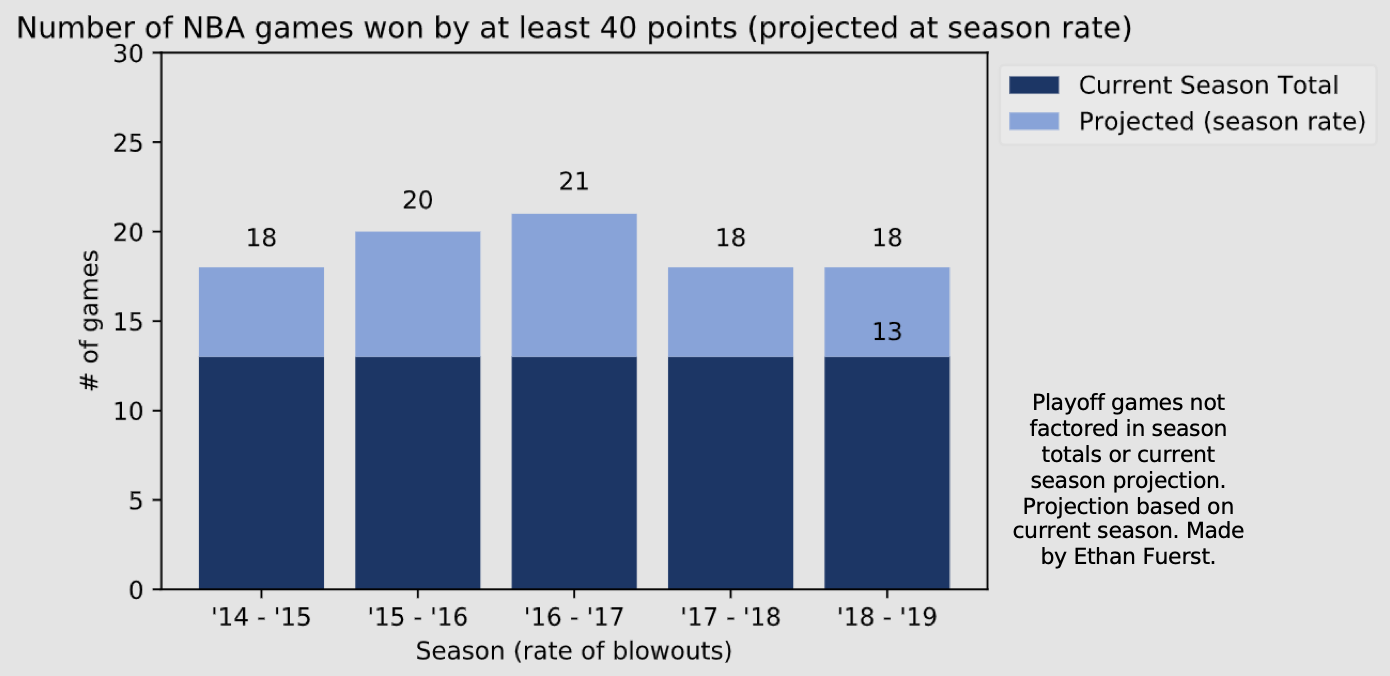
Using the last 5 NBA seasons as a guide, we can expect the total number of 40-point blowouts this season to be between 18-21. This would be the most blowouts for a single season in the NBA since the ABA-NBA merger in 1976.
Count of 40-point blowouts since the '76 - '77 season
| Season | Count of 40-pt blowouts |
|---|---|
| '19 - '20 (Maximum projection) | 21 |
| '19 - '20 (Minimum projection) | 18 |
| '88 - '89 | 13 |
| '91 - '92 | 11 |
| '17 - '18 and '94 - '95 | 10 |
| '16 - '17 | 9 |
| '19 - '20 (as of 12/26/19) | 8 |
| '07 - '08, '10 - '11, '96 - '97, '93 - '94, '92 - '93 and '78 - '79 | 8 |
Data from basketball-reference.com.
Charts made in python using pandas and matplotlib.
Check out my code here